AUTOMATED DATA PROCESSING AND VISUALIZATION
Escape from Excel!
Visualize your data
Excel sheets are one of the most prevalent means of reporting across all types of organizations, often referred to as “Management by Excel.” Many organizations have amassed large collections of Excel sheets for management reporting purposes, which makes it very difficult during a merger or an acquisition to find ways to report and predict on the new combined entity with Excel.
DATA ANALYSIS AND VISUALIZATION
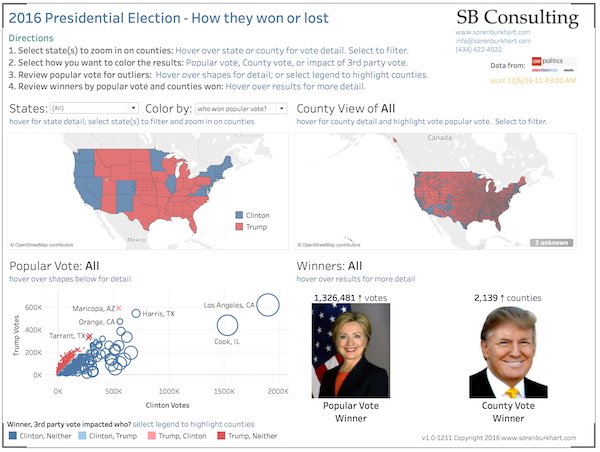
2016 Presidential Election
How They Won or Lost
Using the county voting data from CNN Politics Election Results, the following visualization was created to analyze the popular vote and to identify which counties Clinton and Trump won or lost.


