DATA ANALYSIS AND VISUALIZATION
2016 Presidential Election
How They Won or Lost
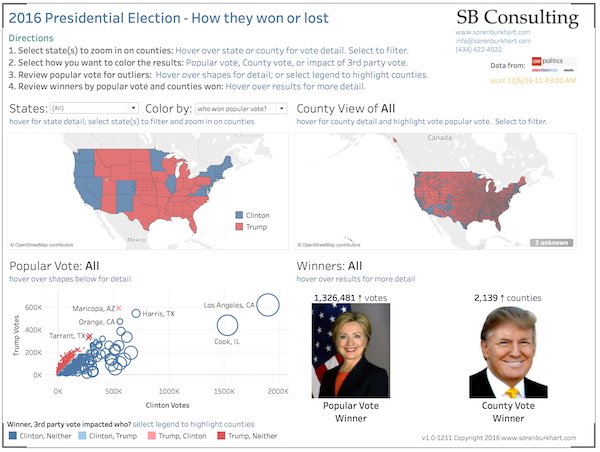
Using the county voting data from CNN Politics Election Results, the following visualization was created to analyze the popular vote and to identify which counties Clinton and Trump won or lost.
The visualization answers the following questions:
How many counties and states did Clinton’s popular vote lead come from?
Clinton had 2.9+M popular vote lead coming from just two counties in two states: 1.7M popular vote lead in Los Angeles County, California, and 1.2M popular vote lead in Cook County, Illinois.
Which candidate won the most counties and what were they?
Trump won 84.3% of all 3,113 counties, Clinton won 15.7%. Trump won 2,626 counties versus 487 counties for Clinton.
Clinton won the majority of counties in eight states/district: California, Connecticut, District of Columbia, Hawaii, Massachusetts, New Jersey, Rhode Island, and Vermont.
Trump won the majority of counties in the remaining 43 states.
What effect did 3rd party voting have on Clinton or Trump?
3rd party voting impacted both Clinton and Trump in only 12 states where the 3rd party vote exceeded the plurality of the winning candidate.
Clinton was impacted in Arizona, Florida, Michigan, Pennsylvania, Utah, and Wisconsin.
Trump was impacted in Colorado, Maine, Minnesota, New Hampshire, New Mexico, and Nevada.
Click here, or on the image to the right to interact with the data analysis and visualization.

